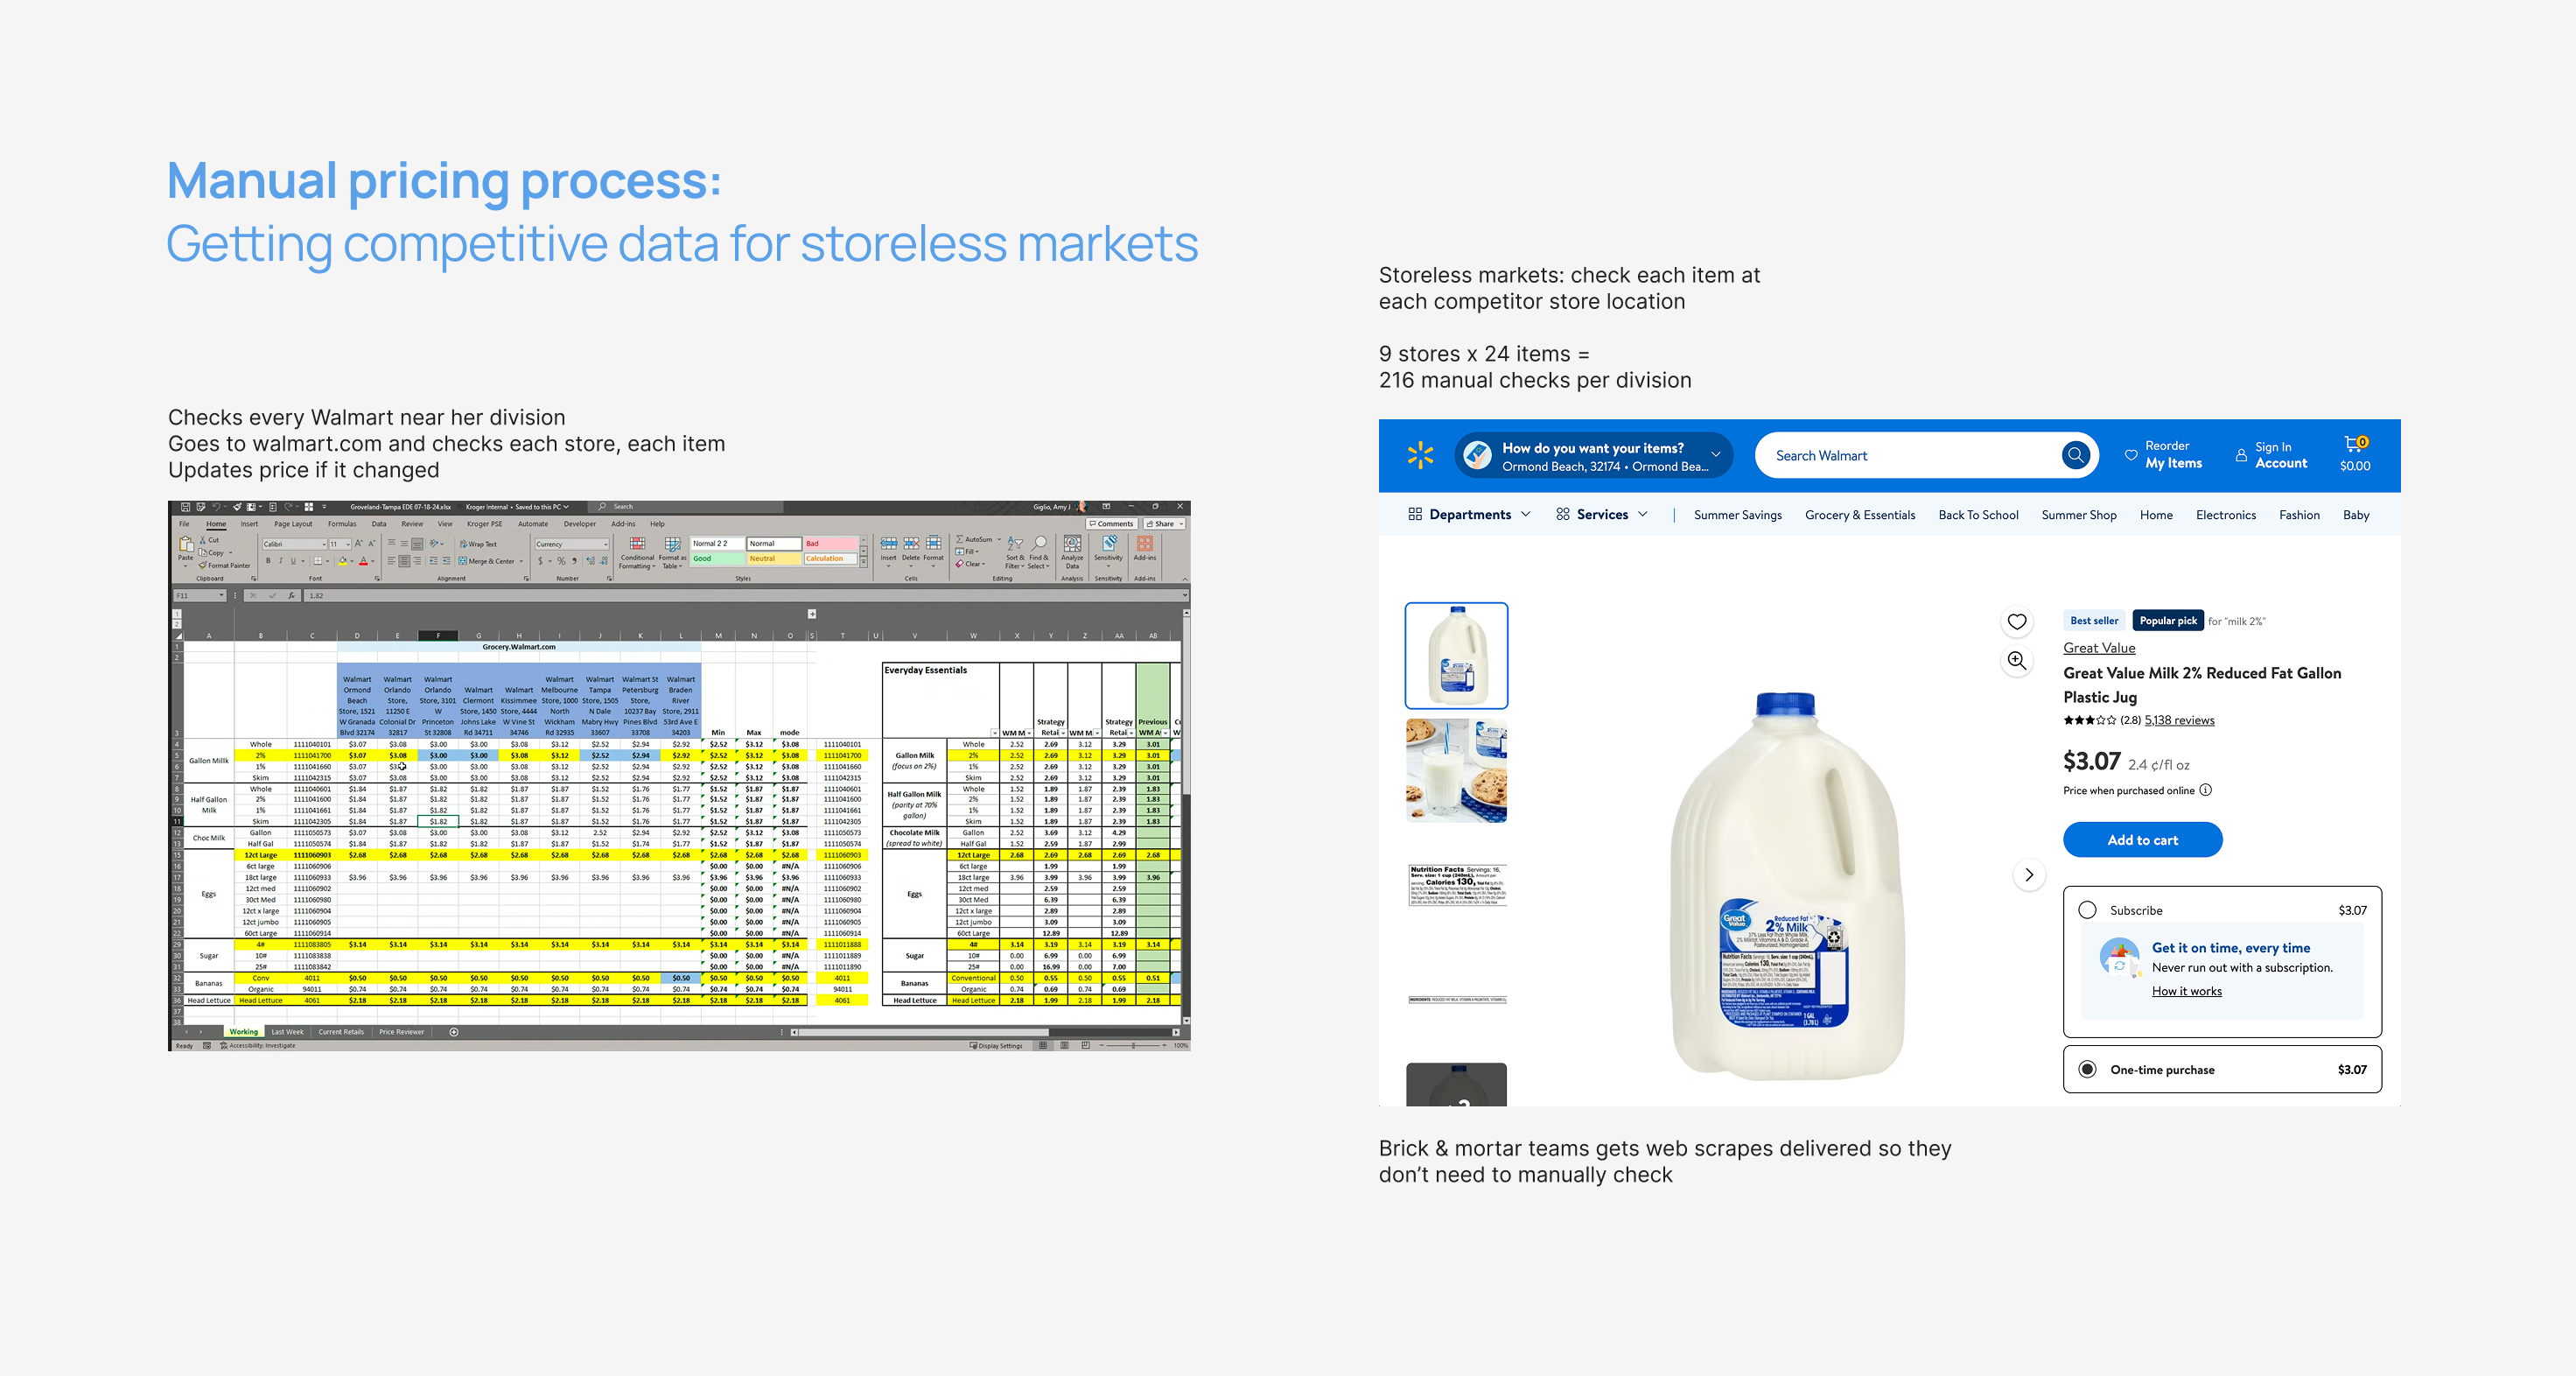
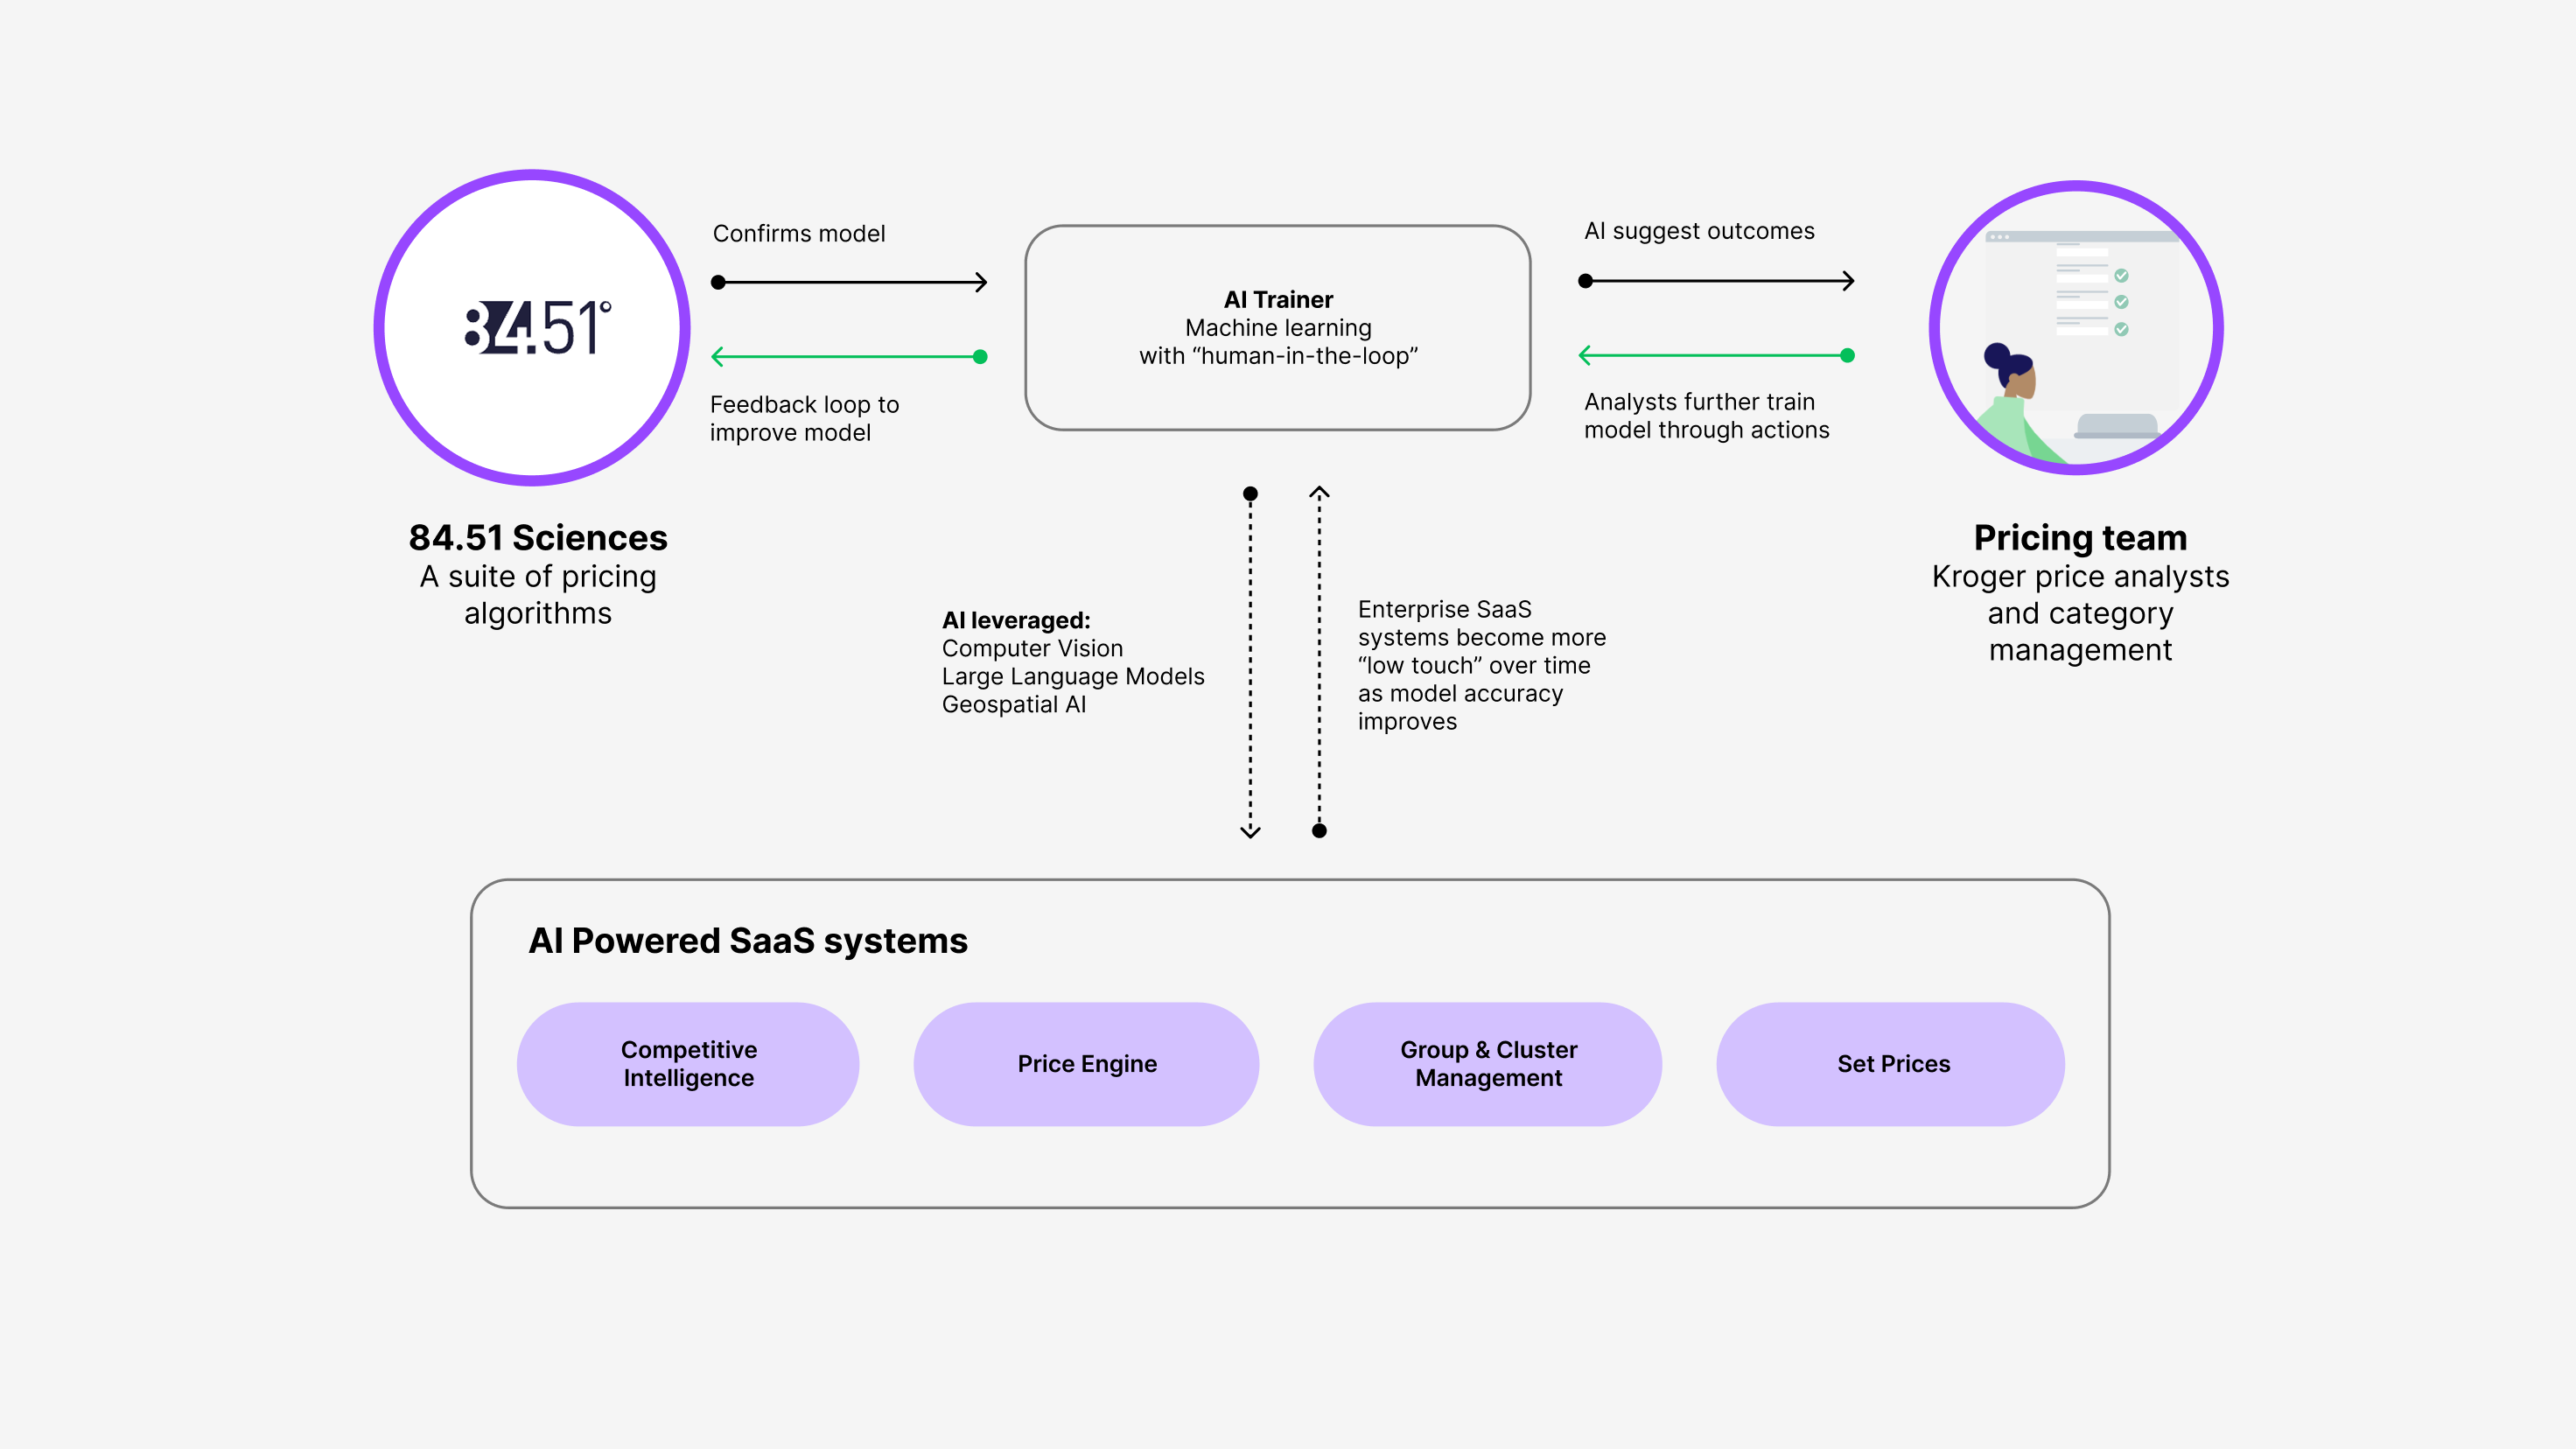
Note: This is a partial version of my Pricing case study. Due to the sensitive nature of the work, some details have been omitted. The full case study is available upon request.
I'll start off by walking through this high level diagram (above), and I'll reference this again as I walk through competitive data management. This diagram represents high level steps and buckets across the end to end pricing journey.
Pricing starts with having a strategic approach to how we want to be positioned in the market based on competitors, profit margins, and customer segmentation expectations.
The images above represent a pricing analyst who checks prices of everyday essentials items in every Walmart near her division, every week, for every item on the list.
9 stores x 24 items = 216 manual checks per division
You wouldn't think a company with over 100 billion in sales a year operates this way, but they do.
Reduce manual effort to review and compare competitive price check data
Reduce manual effort to change any prices that need to change, for any price zone, based on a set of rules criteria
Connect workflows between systems and automate tasks, with only need for a review and approve process
Allow data to flow through real-time and apply different strategies
Stakeholder trust and low design maturity were big challenges throughout this redesign process. It took time to build relationships with stakeholders who are also end users, and many of them have been in their job roles and at Kroger for 20+ years. Working with the team for nearly a year, stakeholders started to become more receptive to new ways of working and engaging with them in workshops, job shadowing, and proper usability testing.
The focus of this opportunity is the competitive intelligence strategy & data management. All pricing use cases involve several of these elements, but I'll focus here on deep diving into how I envision competitive data management in the future and the design that will support those outcomes.
FROM 60 hours a week |
TO 2 hours a week |
While time savings is the primary metric, with a goal of taking these tasks from 60 hours a week across the various price analysts to 2 hours a week. Other metrics that could/will be impacted:
The first primary element of the new experience involves the process to automate mapping items from competitors to ours using exact matches, or possible comparable matches. This recommendation engine allows us to compare assortments to competitors for more understanding of the breadth of store and can be run daily, weekly, quarterly, or any time frame depending on the competitive strategy of the item or category.
The second step in matching products is using visual matching via images and with the ability to have a pricing analyst review these matches in a robust way. Since many of these item links are not exact matches, it's important to have the ability to review and keep the AI model in check. When something is incorrect, a human can adjust it and the ML model improves over time. This process can fix "fuzzy" matches, review broken matches, and check for better auto matches for manually changed matches.
The third element is an insights dashboard aggregates data for groups of items so analysts can see a rollup of how groups of items compare across stores. Users can click through various data visualizations to see full category or program performance across competitors to not only see individual item performance but to analyze the entire basket cost comparisons over time. Analysts can use this information to share with category managers to help inform the category strategy or make adjustments to category goals.
And lastly, price analysts need to be able to easily compare prices across different price zones and channels. At this point the price analyst can select the representative price point for a given price zone or channel. Price analysts need the ability to do this based on different pricing strategies such as the weighted average price, most recent, min, max, etc. These selections will then flow to downstream price setting tools and this data is used to inform pricing decisions.
As this process becomes more automated, a review and edit or approve issues only will allow to price more at scale. Historically pricing was reviewed at very granular levels, but with the pricing model it only needs to be reviewed when the system flags an issue.
Note: This is a partial version of my Pricing case study. Due to the sensitive nature of the work, some details have been omitted. The full case study is available upon request.